The resonant energy response can be
measured in terms of energy, frequency
and phase relationships. The precision
with which the process can be measured
helps define the unique interactive
atomic or molecular response behaviour
of any specific material, according to the
energy bandwidth used. ADR is
measurable on a wide range of
hierarchical scales, both in time and
space.
Time scales may range from seconds
to femtoseconds, while spatial scales
range frommetres to nanometres.
The wide-angle reflection and
refraction (WARR) tracking method is
used to:
n
n
Identify the upper and lower
boundaries of each stratum.
n
n
Determine the inter-layer beam
velocity and mean dielectric
constant (
ε
) of the material in each
stratum.
n
n
Identify the materials in the various
strata from both the
ε
s, known as
molecular or atomic spectral lines
(after fast Fourier transform [FFT]
analysis of the received signals) and
spectral ADR statistical parameters
data, based on known rock types.
ADR accurately measures the
dielectric permittivity of materials
encountered and determines the
ε
of
each layer of rock to an accuracy of at
least 1:400. With deeper penetration and
a narrower ADR beam, the accuracy of
dielectric mapping improves. At a depth
of 1 km, an accuracy of 1:4000 can be
achieved for the mean dielectrics of
narrow layers at this depth.
The
ε
is basically the effect that a
given material has on slowing down the
ADR transmission signal. Determining
the
ε
of each rock layer allows them to
be mapped with a depth calculation
from ground level and can also
determine physical properties of the
rock layer, such as moisture content,
porosity and density indices.
In general, dielectric values for
hydrocarbon layers in the earth tend to
be between 2 and 5 for the author’s ADR
scanner, if water is absent. In geological
terms, the main effect on the signal’s
velocity as it propagates through the
material is the water content. For
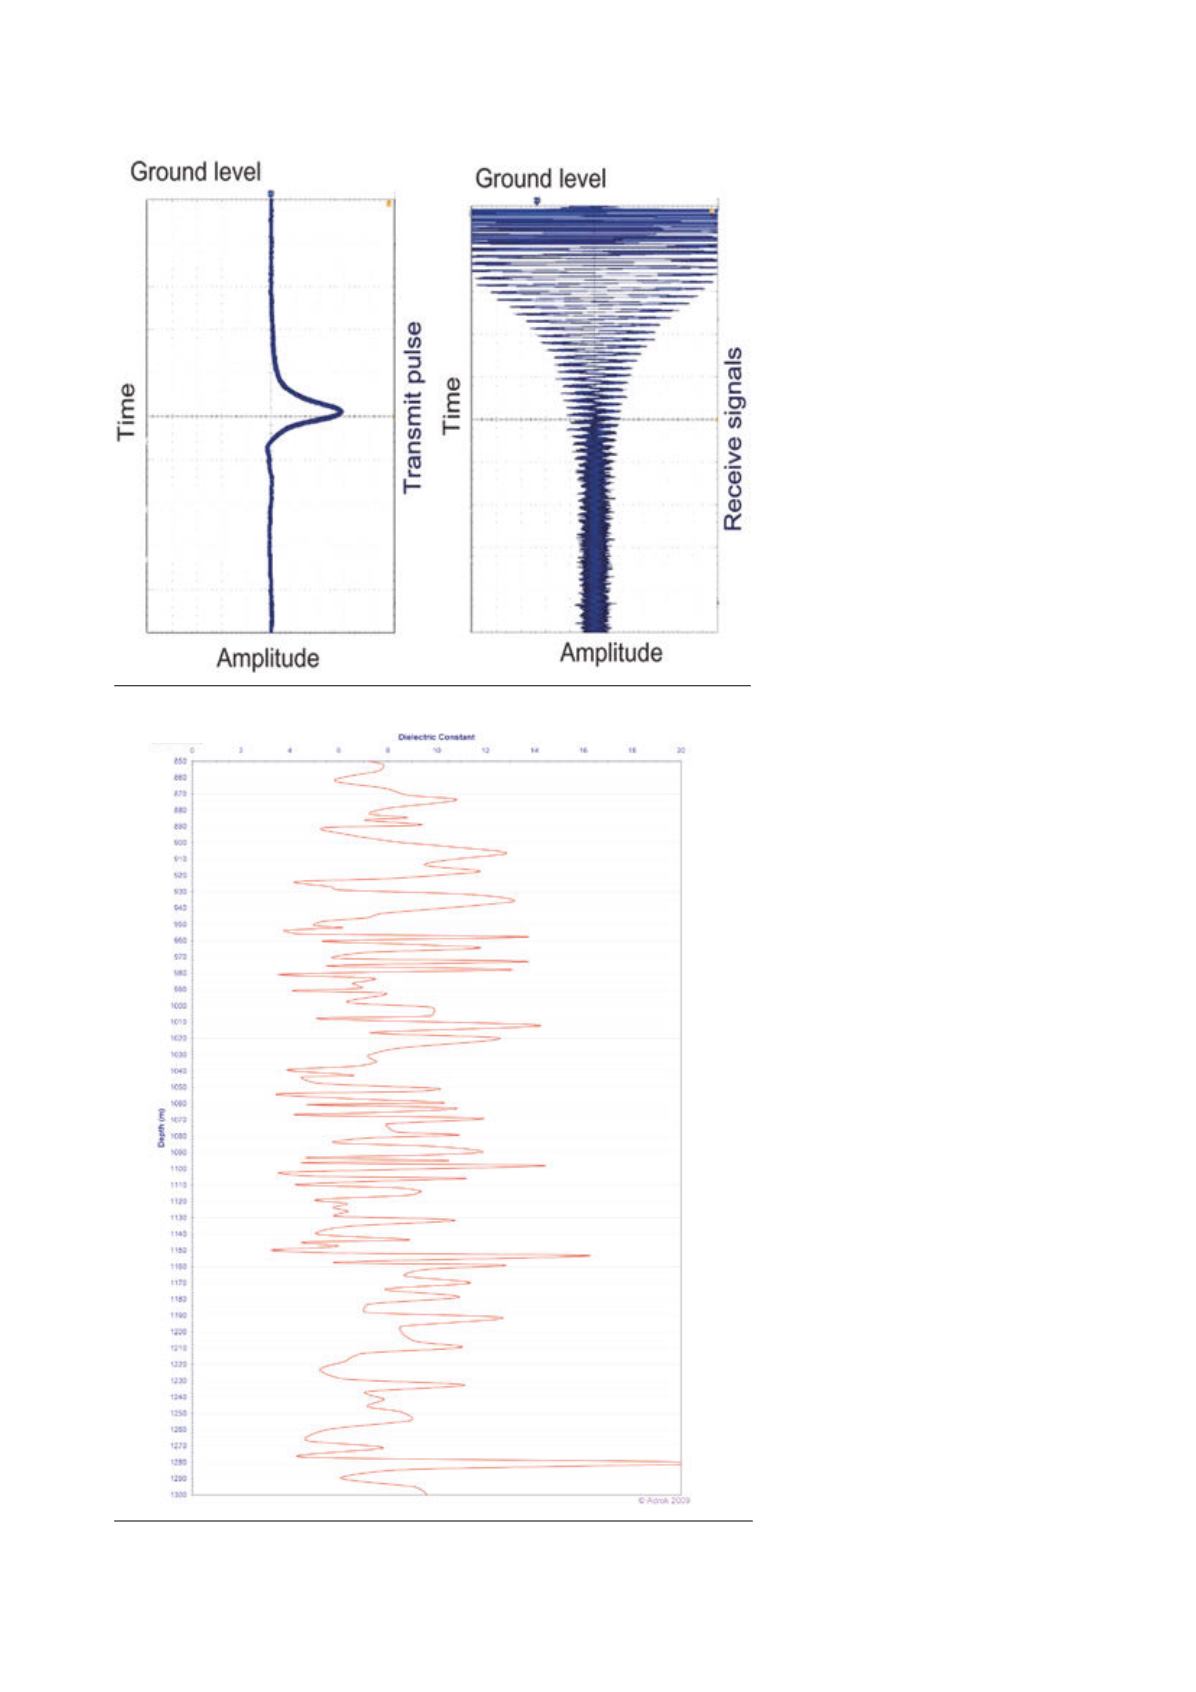
Figure 1.
Examples of a typical ADR transmit pulse and receive signal.
Figure 2.
ADR’s dielectric curve plot with depth on vertical axis.
54
|
World Coal
|
September 2014


