February
2014
OilfieldTechnology
|
67
As the temperature
increaseswhenpumping the
cement slurry into the hole,
themolecular chains extend to
releasemore ions to strengthen
theprotectivefilms, so that
the thickening time increases.
Therefore, a smaller amount
of the additives is required
for greater results. After being
heateddown in thewellbore,
the cement slurrywill be
cooleddownwhen returning up
through the annulus, and the
molecular chains then contract
to recombine the extra retarding
ions in the cement slurry
togetherwith the selective
preference of thepolymer
monomers. So, the slurry
develops strengthquickly.
Goodlinearrelationship
Figures 1, 2 and 3 show the
linear relationshipbetween
the thickening time andweight
percentage of GT‑20L retarders
in the total solidphase. The
formula’s components (except
water) used for testing are
referred to inTable 1. The
thickening time versusweight
percentage of GT‑20L retarders
added is in a good linear
relationship, the thickening
time increaseswith the
increasing of GT‑20L retarders’
weight percentage, so it is easy
to control the thickening time
by adjusting thedosage of the
retarders.
Superhightemperature
cementingjobs
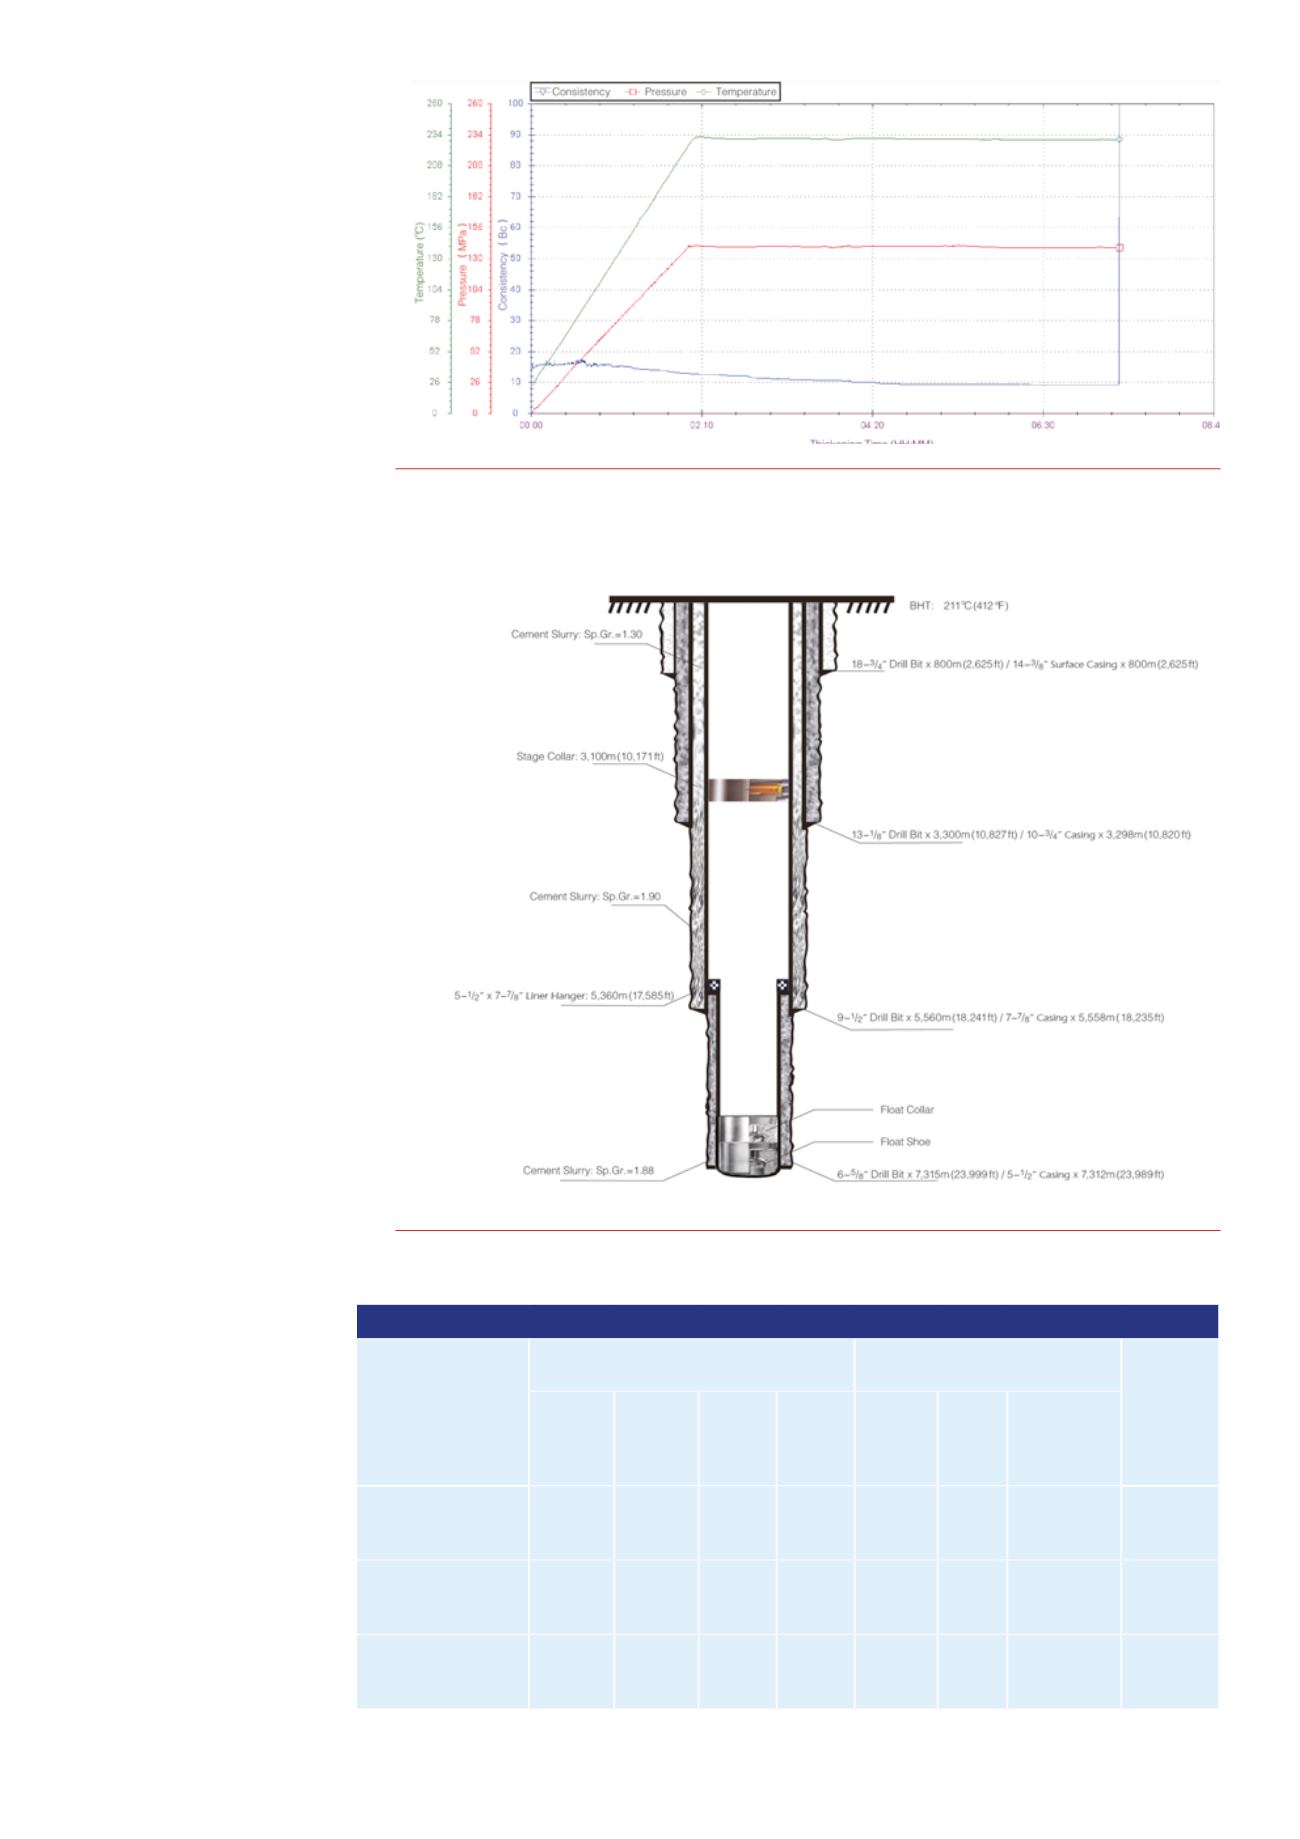
Figure 4 shows the evaluation
testing results at 446˚F.
The formula’s components
(exceptwater) used for
testing are referred to in
Table 2. From Figure 4, the
following conclusionwas
obtained: the additives
canbe used for super high
temperature cementing jobs.
Figure 4 shows the
evaluation testing curve
for the cementing job
planning of cementing the
annulus between 5
½
in.
liner and 6
⅝
in. hole in the
Gucheng Xwell. Figure 5
shows the casingprogramme
Figure4.
Thickeningcurveat230˚C(446˚F).
Figure5.
CasingprogrammefortheGuchengXwell.
Table 1. Formula of solid cement (320˚F)
Component
Liquid additive’s percentage (weight of
additive/total solid phase’sweight)
Weight of cement and other
solid additives (lb)
Total
solid
phase’s
weight
(lb)
GT‑10L GT‑20L GT‑30L GT‑66L
ClassG
cement
Silica
fume
Micro‑silicon
Figure 1, 321 ˚F
(160.8 ˚C)/17 303 psi
(119.3Mpa)
5.00
3.70
1.50
0.10
100
35
5
140
Figure 2, 322 ˚F
(160.9 ˚C)/17 390 psi
(119.9Mpa)
5.00
4.20
1.50
0.10
100
35
5
140
Figure 3, 321 ˚F
(160.6 ˚C)/17 361 psi
(119.7Mpa)
5.00
4.80
1.50
0.10
100
35
5
140


