14
LNG
INDUSTRY
SEPTEMBER
2014
through service area dedicated pipelines. With a view to
avoiding duplication of facilities, a monopolistic market
situation has been created in the city gas supply areas. These
markets are regulated to take care of the interests of small
volume consumers. The market is deregulated for consumers
whose annual contracted volumes exceed 100 000 m
3
.
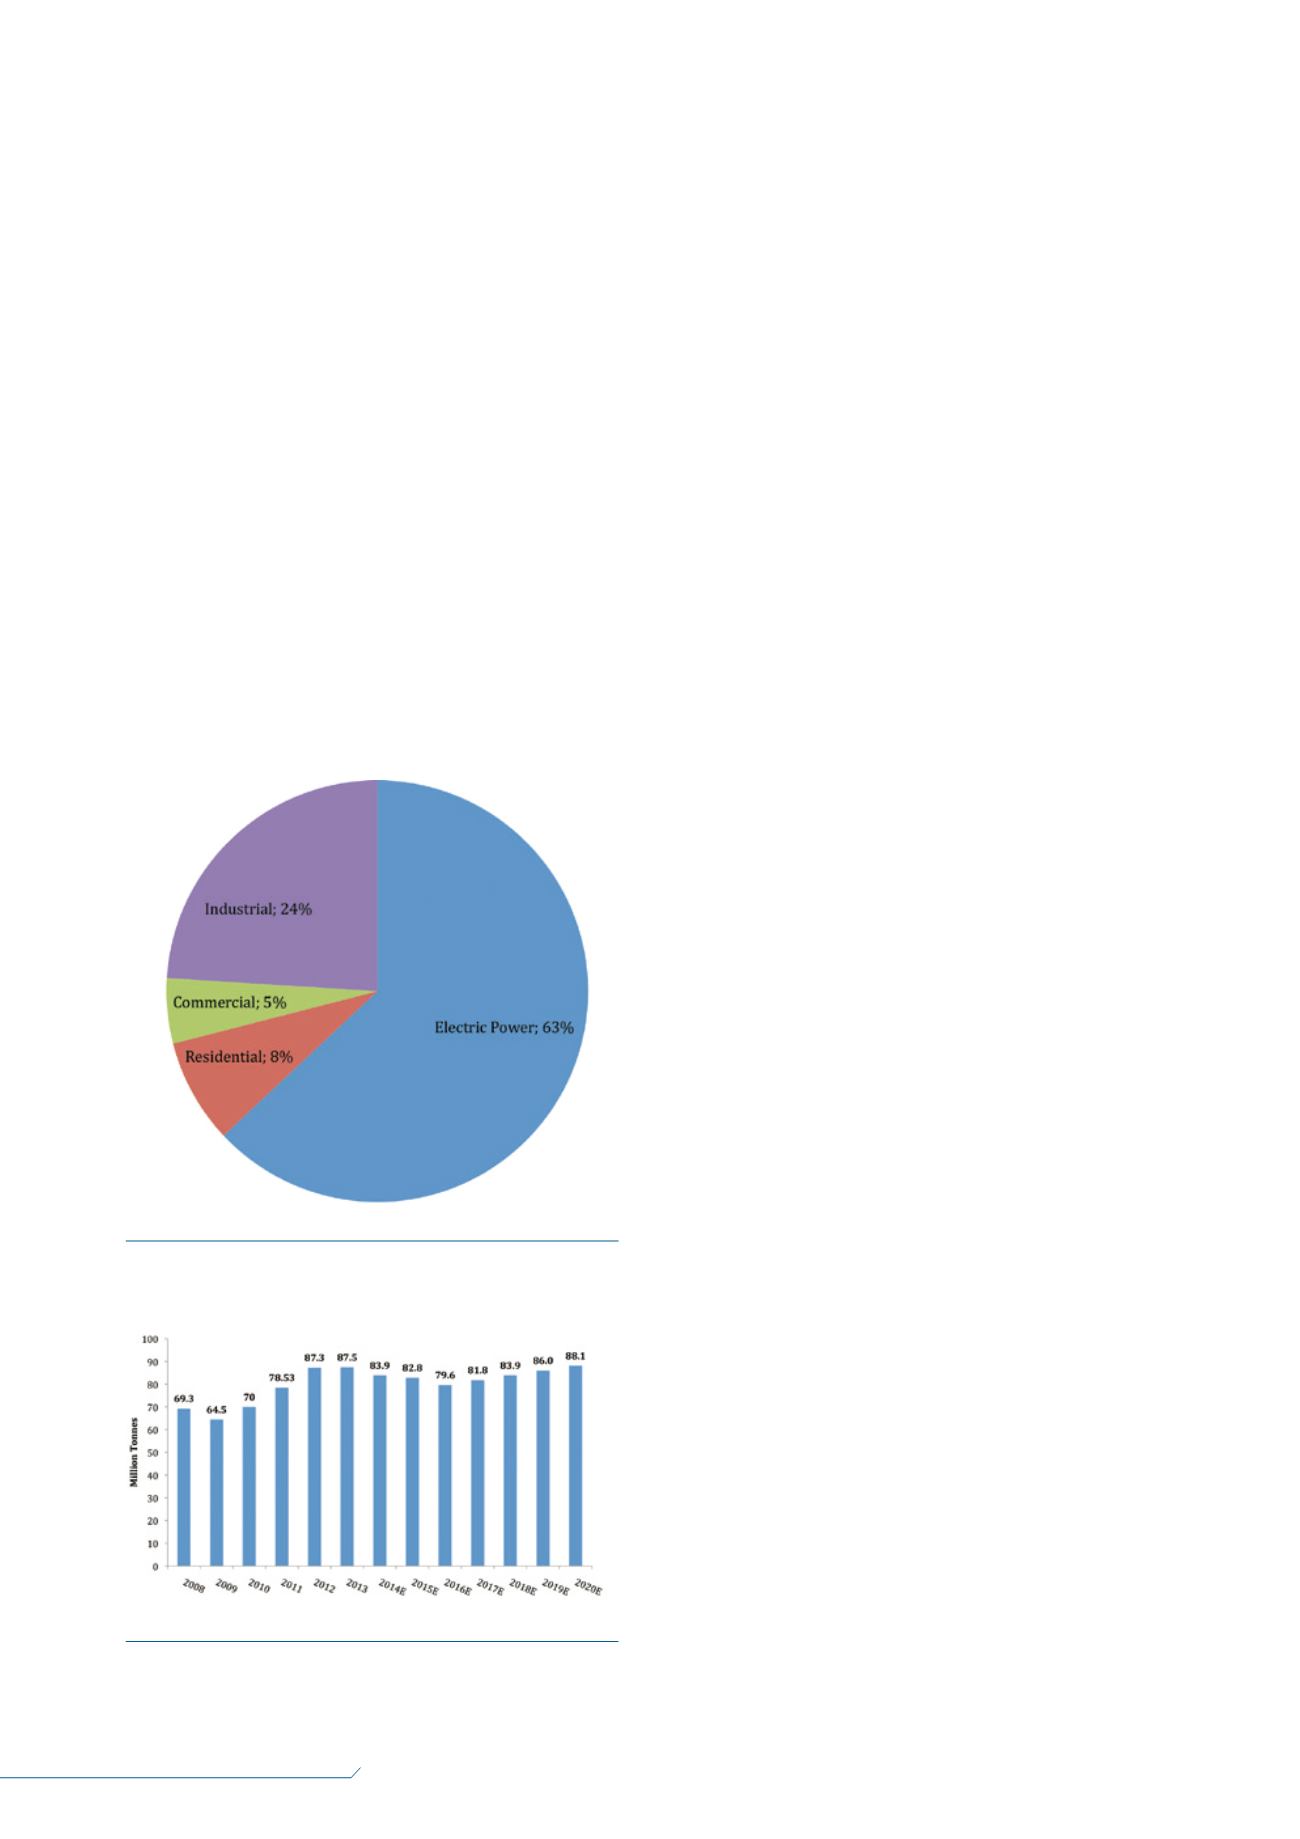
Electric utilities account for 65% of the LNG imported into
the country.
Japan imported 87.5 million t of LNG in 2013 to meet
power generation and city gas needs. With nuclear power
facilities shut down, the power generation segment has been
heavily dependent on natural gas and coal for the past three
years. Around 65% of the total demand for LNG is from the
power generation sector when nuclear facilities are offline.
The share of LNG in the power generation fuel mix jumped
from 29% in 2010 to 41% in 2011 to compensate for the loss
of nuclear power. The city gas supplies cater to industrial,
commercial and residential segments.
Gas demand from the power generation segment will
decrease as nuclear power is expected to make a very slow
comeback in the power generation fuel mix from Q4 2014.
However, plans to increase the installed gas power
generation capacity to approximately 80 GW by 2020 from
the current level of 65 GW is expected to drive up the gas
demand.
Base case scenario for LNG
imports
Frost & Sullivan’s base case scenario forecasts project that
Japan will need to import 88.1 million t of LNG by 2020. The
demand for LNG is expected to show a slight decline up to
2016 before taking an upward trend up to 2020.
The base case scenario projects an increasing demand
trend considering the following assumptions:
Slow growth in electricity demand.
Gradual re-entry of nuclear power into the grid from 2014.
Progressive decommissioning of nuclear power plants
older than 40 years.
Gas power generation installed capacity addition.
Increase in city gas demand.
City gas demand sees increased demand from industrial
and commercial segments but a decline from the
residential segment.
Increasing LNG imports have taken the fuel’s prices to
new highs, creating trade deficits for the world’s third largest
economy. The country’s strategy focus is towards making
LNG imports secure and at the same time cheaper.
The electric utilities and city gas distribution companies
import LNG into Japan, sourcing it from long-term contracts
and spot purchases. Up until 2010, spot purchases were less
than 5% of the total LNG procured. In the last three years,
spot purchases have increased to over 20% of the total
procurement.
Strategies for reducing LNG
purchase price
Since electric utilities are the largest buyers of LNG from
Japan, there is a growing consensus that instead of passing on
increasing fuel costs to electricity consumers, the large LNG
buying companies should work out strategies to reduce the
LNG purchase price.
The LNG prices following the oil prices show a steadily
increasing trend after 2010. Japan pays the highest average
prices for LNG in the world, and these prices have increased,
driven by Japan’s dependence on spot market purchases after
the Fukushima incident in 2011.
In the scenario where nuclear power is not brought online
at all, Frost & Sullivan forecasts the LNG imports to reach a
high of 102 million t. At the current purchase price levels, it
would be unsustainable for the Japanese economy to import
such high volumes, hence the focus is on strategies to reduce
LNG purchase prices.
To meet this objective, various strategies are being
adopted by the Japanese government and the LNG importing
companies to reduce purchase prices.
LNG importers venturing into trading
business
With an increase of LNG suppliers in the global market, LNG
buyers are seeking flexible terms, such as options to resell.
Large LNG buying companies such as Tokyo Gas are
intending to enter into the LNG trading business, reselling
Figure 1.
Japanese gas demand by end user segments, 2013
(Frost & Sullivan estimates).
Figure 2.
LNG imports: Frost & Sullivan’s base case
scenario (Frost & Sullivan forecast. Historical data compiled by
Frost & Sullivan from various industry sources).


