48
LNG
INDUSTRY
SEPTEMBER
2014
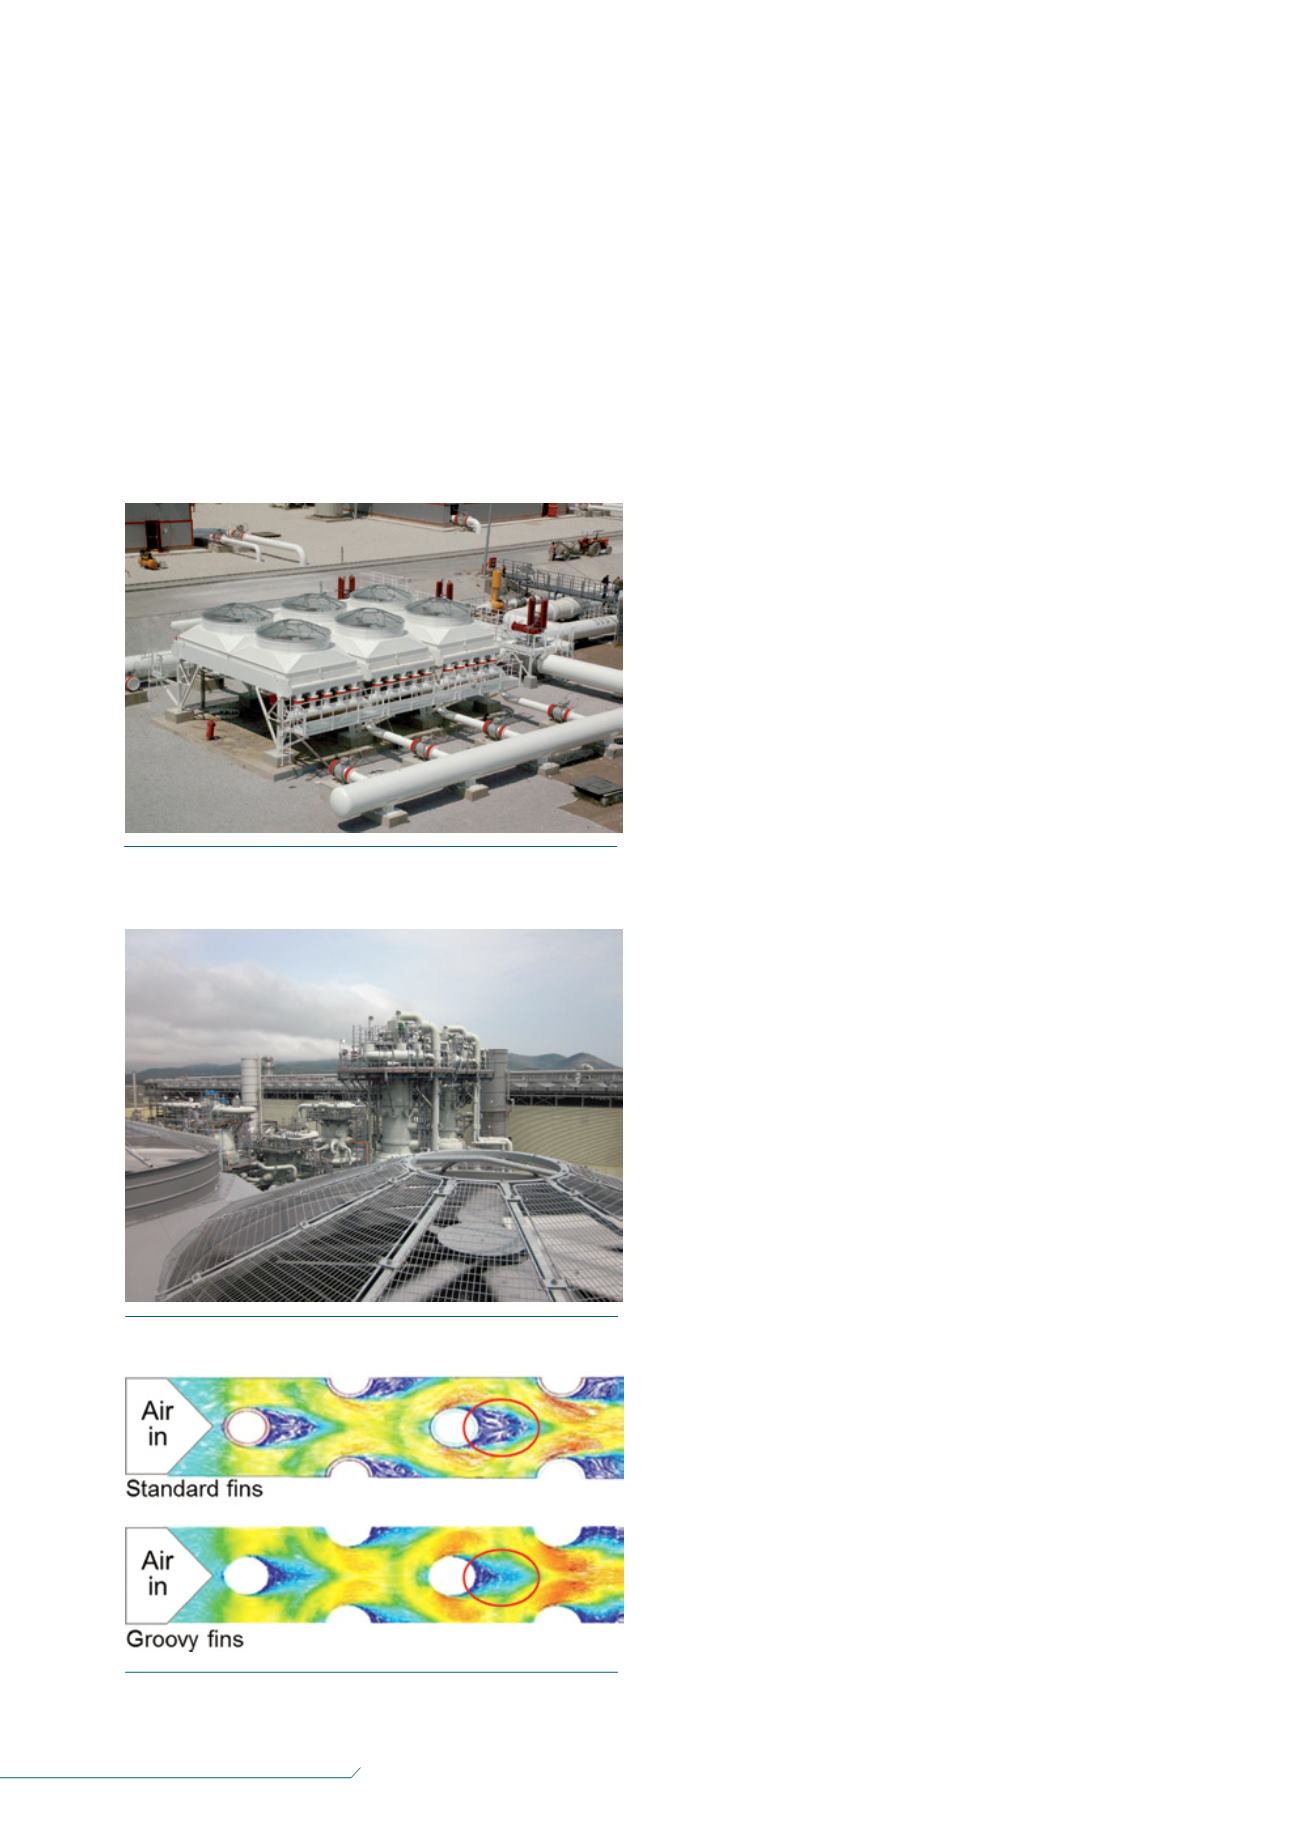
based on grooves that are etched on the fin surface,
bringing guidance to the air flow behind each tube. Figure 3
shows a top view of the velocity fields of a four row bundle
in the mid plan between two fins at a front velocity of
3 m/sec, with normal fins on top and groovy fins at the
bottom. Upon observation of the two pictures, it is clear
that the grooves at the fin surface allow substantial
reduction of the recirculation area.
Enhancing ACHE performance
Representative small scale prototypes of the groovy fin
concept have been widely tested in wind tunnels in more
than 15 configurations of fin pitch, tube rows, tube pitch
and tube diameter. The typical dimension of the small
scale prototype is a frontal section of 1 x 1 m and they
have also been equipped with 4 - 8 rows of tubes. Before
conducting the tests, a complete validation of the wind
tunnel measurements was undertaken. The tests were
then performed by increasing the air front velocity from
0.5 m/sec to 4 m/sec with a hot fluid circulating inside the
tubes. The equipment facilitates the precise measurement
of temperatures, flow rates and pressure on both the air
side and the water side. Heat balances are calculated from
the measurements to precisely determine the air side heat
transfer coefficient. The elevation of the pressure when
the air is passing through the bundle is measured together
with velocity determination. Comparisons with standard
plain fin designs show enhancement of the air side heat
transfer coefficient by up to 30%, while corresponding
pressure losses increase by 25% at the same front velocity.
When translating the enhancements onto the equipment
for a given operating point at the fan system, air side heat
transfer coefficient increases by 25%.
Figure 4 shows a comparison of external heat transfer
coefficient related to the bare tube surface, with regards to
the fan consumption for a four tube row bundle equipped
with standard and groovy fins with a pitch of 10 and
11 fins per in. (FPI) and tubes of 1.25 in. outside diameter.
Fouling resistance
A campaign of fouling tests has been launched to
evaluate the behaviour of the groovy fin in relation to
fouling. A dedicated test procedure was set up to obtain
representative results compared to typical fouling from the
field. A fouling test consists of spraying dust in a greasy
environment onto a prototype installed in a wind tunnel
and measuring the elevation of the pressure drop. Figure 4
shows a small scale prototype after a fouling test has been
conducted. Measurements have shown that the behaviour
of a grooved fins bundle is very similar to a conventional
fins bundle. Figure 5 shows the result of a measurement on
a small scale prototype.
It can be observed that each 100 g of dust sprayed onto
the bundle resulted in a 10 Pa pressure drop increase for
both groovy fins and standard fins.
Cleaning
After each fouling test, cleaning was performed using
conventional machines used to clean ACHE in plants, at a
pressure of 80 bar. The final test consisted of a comparison
between the pressure losses at different frontal velocities
from non-fouled bundles and bundles cleaned after fouling.
No pressure drop difference could be measured, meaning
that the groovy fin bundles were perfectly cleaned.
Mechanical resistance
The mechanical resistance of finned tubes is important to
ensure that the performance of the ACHE is not affected by
damage caused by an impact on the finned tube bundle.
A series of tests, which consisted of applying a weight
of 100 kg on each tube, were performed to evaluate
the behaviour of the groovy finned tubes compared to
conventional fins. The resistance of the finned tube was
Figure 1.
Typical air cooled heat exchanger (three bays, each
made of two bundles and two fans).
Figure 2.
View of an LNG train of air coolers.
Figure 3.
Velocity fields of a four row bundle in the mid plan
between two fins at a front velocity of 3 m/sec.


